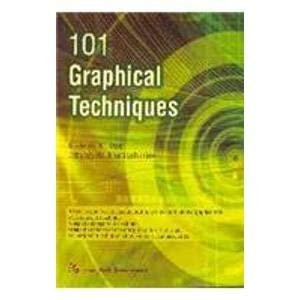
The book comprises of 101 statistical plots that can be used for analysis, display and comparison of data. Data sets are provided with most of the plots and relevant calculation if any are also shown. The variables considered along the axed are highlighted and the interpretation of the graph is also discussed. The uses of each of the graphical tool are forwarded along with some related statistical/graphical tools.
Extensive point wise discussion about many known and unknown graphical tools.


Reviews
There are no reviews yet.